NFL Receiving Prop Bets: Yardage, Receptions and Target Share
 Available in US
I made more profit on receiving props than any other prop category last season, and the reason had nothing to do with knowing which receivers were the most talented. It had everything to do with one metric: target share. When you understand who is getting the looks and why, the receiving prop market opens up in ways that yardage and touchdown markets simply do not. The talent is public knowledge. The target distribution is where the edge hides.
NFL Reception Totals and Target Share Betting Signals
Reception totals are the most stable receiving prop, and stability is your friend in a volatile position group. A wide receiver’s reception total in any given game is a function of targets, catch rate, and route volume. Of those three, targets is the variable that fluctuates least week to week for established starters.
Target share – the percentage of a team’s total targets directed at a specific receiver – is the metric I use as my primary projection input. A receiver commanding 25% or more of his team’s targets on a consistent basis has a floor that the casual bettor often underestimates. Even in a bad game for the offence, a 25% target share on 35 team pass attempts yields roughly 9 targets, and a receiver who catches 70% of his targets turns that into 6 receptions. If the line is set at 5.5, the over is live even in an unfavourable scenario.
The NFL generates more wagering handle than any other league at major operators, per ESPN and DraftKings reporting, and the receiving prop market has grown considerably as sportsbooks offer more granular individual performance lines. That growth means more liquidity and sharper pricing, but it also means that the casual public’s biases – chasing big-name receivers regardless of matchup – create persistent mispricings on secondary targets and slot receivers who see high volume without the headline attention.
I cross-reference target share with air yards share, which measures what percentage of a team’s total intended passing yardage is directed at each receiver. A high target share with low air yards share indicates a receiver who runs short routes – his reception prop is safer but his yardage ceiling is lower. A high target share with high air yards share suggests a deep-threat role where catches are fewer but yards per reception are higher. Matching the right prop to the right receiver profile is essential.
Cornerback Matchups and Coverage Schemes
Every week I build a matchup chart for my target receivers, and the single most predictive variable on that chart is the opposing cornerback’s coverage assignment.
If a receiver lines up primarily on the outside and draws a shadow corner – a defender who follows him regardless of formation – the matchup is defined before the game even starts. Elite shadow corners can reduce a top receiver’s production by 20-30% compared to his season baseline. Conversely, if the defence plays zone and the receiver faces a rotation of defenders, the matchup is softer and the prop line may not fully reflect it.
I pay close attention to which teams use shadow coverage and which do not. Teams with a true lockdown corner – the kind who travels with the opponent’s best receiver – create obvious under spots on that receiver’s yardage and reception props. Teams that refuse to shadow, preferring zone concepts, open the door for target-dominant receivers to hit their numbers regardless of the defensive personnel.
Injury matters here more than at any other position. If the starting cornerback who typically shadows the best receiver is ruled out, the replacement is almost always a downgrade. That downgrade may not be reflected in the receiving prop line until late in the week, when the injury report finalises. I set alerts for cornerback injury updates across every team whose opponent features a receiver I am considering for a prop bet.
Slot vs Outside Receivers: Different Prop Profiles
Slot receivers and outside receivers play different games, face different defenders, and generate different statistical profiles. Treating them interchangeably in prop analysis is a mistake I made early and corrected after one frustrating season of blown projections.
Slot receivers typically face nickel corners or linebackers in man coverage, and they run shorter, quicker routes. Their reception totals are higher on average, their catch rates are higher, and their yardage per reception is lower. A slot receiver with a 5.5 reception line is a fundamentally different proposition from an outside receiver with the same line – the slot player’s floor is higher because his role generates more consistent volume.
Outside receivers face the opponent’s best cornerbacks and run a wider variety of routes, including deep shots that are high reward but low probability. Their reception counts are more volatile, their yardage totals swing more dramatically game to game, and their prop outcomes are harder to project. I prefer reception props for slot receivers and yardage props for outside receivers – matching the prop type to the statistical profile of the role.
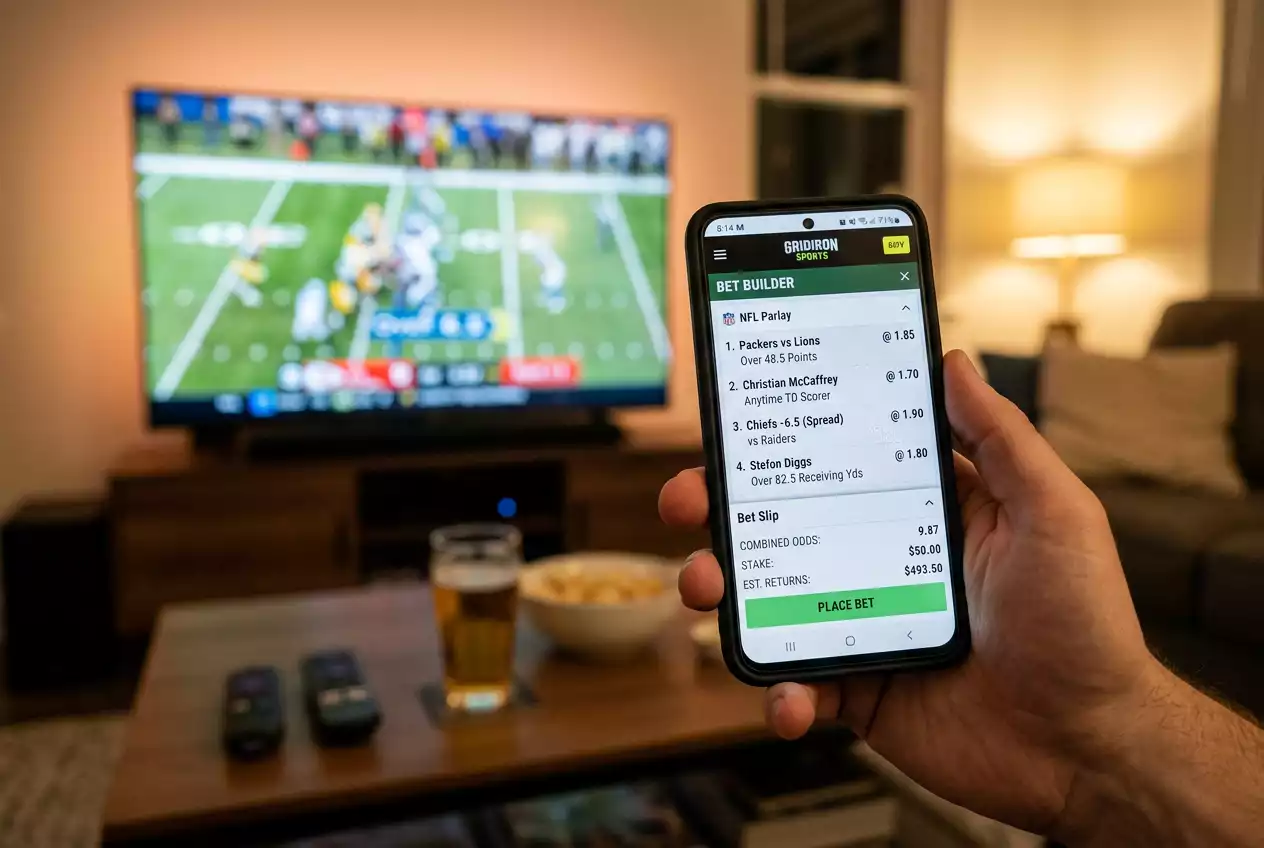
The NFL’s 2025 broadcast advertising policy, which permitted up to six sportsbook ads per game per RG.org, has brought prop betting further into the mainstream viewing experience. But the mainstream conversation focuses on touchdowns and big plays – the flashy outcomes. The edge in receiving props lives in the quiet, predictable patterns of target share, catch rate, and role-specific volume. For a broader understanding of how individual performance markets intersect with bet builders and accumulators, I have written a dedicated guide on combining NFL markets in a single slip.
What is target share and why does it matter for receiving props?
Target share is the percentage of a team’s total pass targets directed at a specific receiver. A receiver with a 25% or higher target share has a consistent floor of opportunities regardless of game script, making his reception and yardage props more predictable. Target share is the single most stable predictor of receiving prop outcomes because it reflects the receiver’s role in the offence rather than fluctuating game-by-game factors like touchdowns or big plays.
Do slot receivers have more predictable reception totals?
Yes, generally. Slot receivers run shorter, higher-percentage routes and face less physically dominant coverage than outside receivers. Their catch rates tend to be higher and their reception totals more consistent game to game. This makes reception props on slot receivers more projectable than the same prop on outside receivers, who face tougher matchups and run more volatile route trees including deep shots.
Created by the ”nfl Betting Ofds” editorial team.