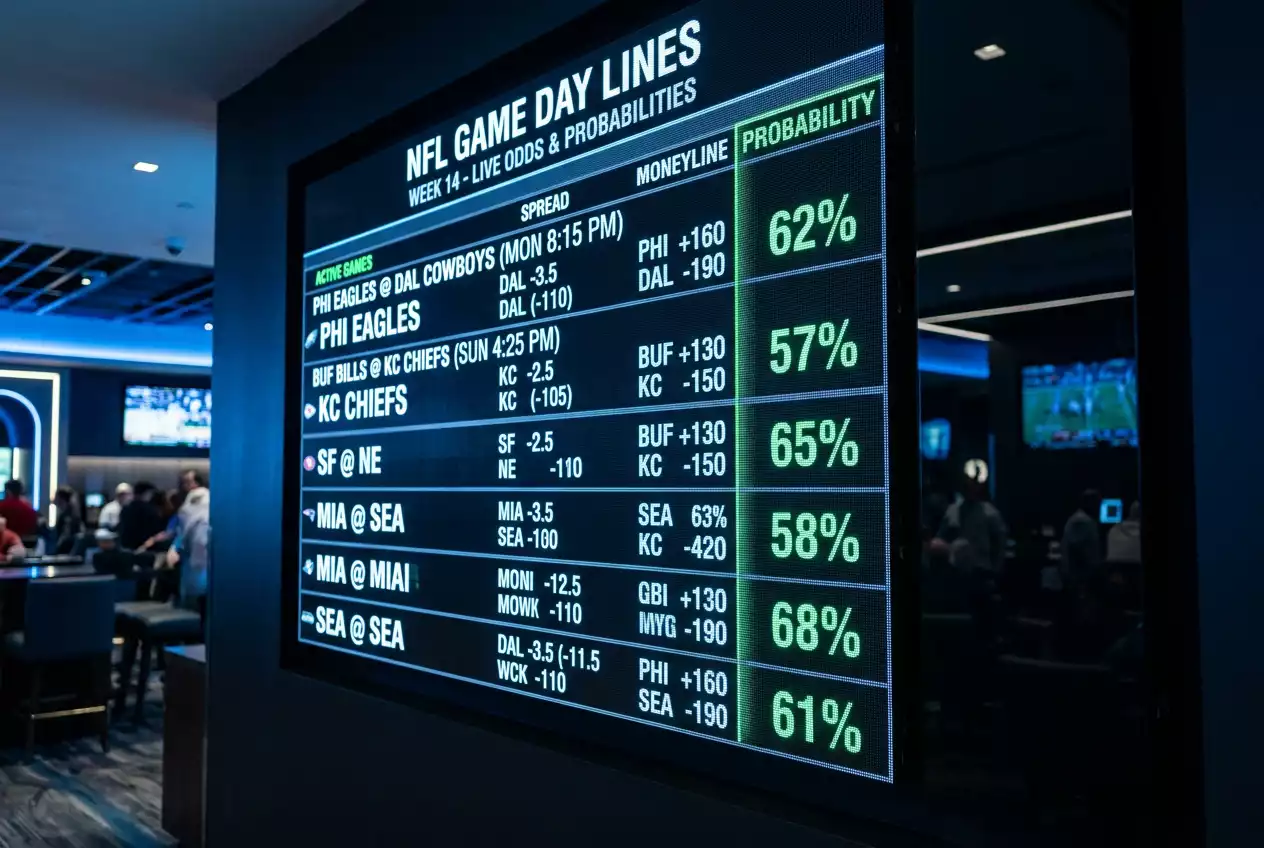
NFL Quarterback Prop Bets: Passing Yards and Touchdown Odds
 Available in US
Quarterback props are the market where I have made – and lost – the most money of any prop category. The reason is straightforward: quarterbacks touch the ball on every offensive snap, which makes them the most projectable position on the field. But projectable does not mean predictable, and the gap between those two words contains an entire season’s worth of lessons about game script, defensive matchups, and the illusion of certainty.
The NFL generates a higher wagering handle than any other American league at major operators, per ESPN reporting, and quarterback props capture a disproportionate share of that prop volume. The market is deep, the lines are sharp, and the edge is narrow – which is exactly the kind of challenge I enjoy.
NFL Quarterback Passing Yardage Lines and Market Pricing
Last season I tracked every passing yardage line for starting quarterbacks across the first eight weeks, comparing the posted number to my projection. The average difference was 11 yards. In a market where lines sit around 240-270 yards, eleven yards is noise – the bookmaker was almost perfectly calibrated. Finding value required going deeper than the headline number.
Passing yardage is driven by three primary factors: pace, pass rate, and opposing pass defence. A quarterback on a team that runs 65 plays per game and passes on 60% of them has a projected attempt volume of roughly 39 passes. Multiply by his yards-per-attempt average, and you have a baseline yardage projection. The opposing pass defence adjusts that baseline up or down – an elite secondary might reduce expected yards per attempt by half a yard, while a porous unit inflates it.
The subtlety is in the second-order effects. A strong running game reduces pass volume but can increase yards per attempt because defences play the run and leave the passing lanes more open. A team trailing in the second half passes more frequently, inflating total yardage even if the efficiency is poor (lots of short completions on hurry-up drives). I project passing yards using both a volume model (attempts times YPA) and a game-script model that adjusts for expected scoring differential, then average the two projections.
The bookmaker’s line is usually close to the right number. The value I find tends to come not from the overall yardage total but from the tails – games where my model projects a notably higher or lower figure due to matchup specifics that the market has underweighted.
Touchdown and Interception Props: Correlated Volatility
A quarterback who throws three touchdowns in a game probably attempted a lot of passes in favourable situations. A quarterback who throws three interceptions probably attempted a lot of passes in desperate situations. Both outcomes share a common root: high-volume passing. That correlation is the key to evaluating TD and INT props together rather than in isolation.
Touchdown props are typically set at 1.5 for most starting quarterbacks, with the over juiced at around -140 to -160 and the under at +110 to +130. The line reflects that an average NFL quarterback throws between 1.5 and 2.0 touchdowns per game, and the vig ensures the bookmaker profits regardless. I look for spots where the matchup pushes the expected number significantly above 2.0 – a pass-funnel defence that gives up red-zone touchdowns at an above-average rate paired with a quarterback who has a high touchdown rate inside the 20. These confluence spots appear three or four times per week and represent the best touchdown prop value.
Interception props are harder to project because interceptions are inherently volatile. Even elite quarterbacks throw interceptions at a rate of about 2% of pass attempts, which means the difference between zero and two picks can come down to a single tipped ball or a miscommunication on one route. I rarely bet interception overs unless the matchup features a quarterback with a historically elevated turnover rate against a defence that generates a high interception percentage. The under on interception props – typically set at 0.5 with heavy juice on the under – is almost never worth the price.
How Game Script Shapes QB Prop Outcomes
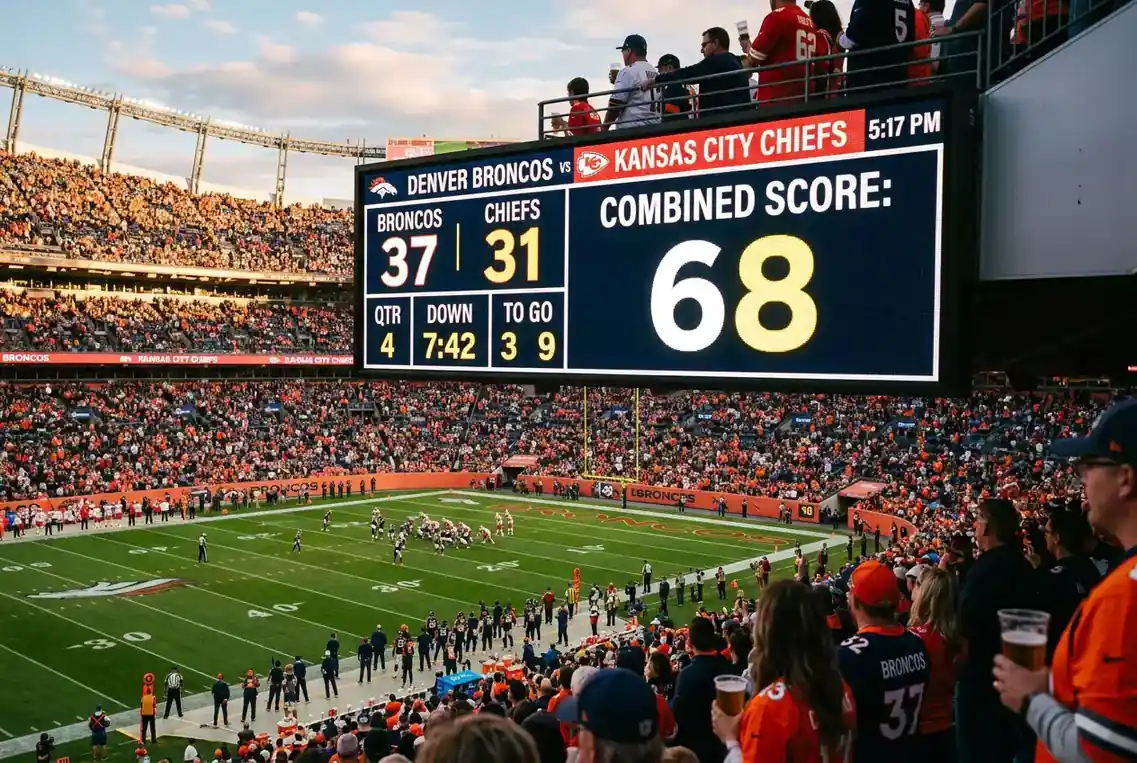
During the 2025 season, NFL broadcasts carried up to six sportsbook advertisements per game, per NFL policy and RG.org. The visibility of betting odds during live telecasts has made game-script awareness mainstream, but most casual bettors still underestimate how dramatically the expected score differential affects quarterback prop outcomes.
When a quarterback’s team is trailing, his passing volume increases, his yards accumulate, and his interception risk rises. When his team is leading comfortably, the offence shifts to running the ball, and passing stats plateau. This means that a quarterback projected to throw for 260 yards might end up at 310 if his team falls behind early, or at 210 if his team leads by three scores in the second half.
I incorporate game script into my quarterback prop analysis by using the point spread as a proxy for expected game flow. If a quarterback’s team is a six-point underdog, I expect him to throw more passes than his season average suggests, because the team is likely to trail and the second half will feature more pass-heavy drives. Conversely, if his team is a double-digit favourite, I expect reduced passing volume in the second half as the coaching staff protects the lead.
The practical application is simple: lean over on passing yardage for quarterbacks on underdog teams and lean under for quarterbacks on heavy favourites. The effect is not large enough to bet blindly, but it is a consistent tilt that improves the accuracy of my prop projections by two to three percentage points over a full season. For a broader look at how all player prop markets – not just QB props – operate and where the value hides, I have covered the full landscape in my guide on NFL player props and individual performance betting.
Do quarterback passing yardage props include overtime?
Yes. Passing yardage props settle on the final official stats, which include any yards accumulated during overtime periods. This is worth considering when analysing close games between evenly matched teams, as overtime drives can add 30 to 80 passing yards to a quarterback’s total. The effect is small in expected-value terms because overtime occurs in a minority of games, but it does push marginal overs across the line occasionally.
How does game script affect QB prop bets?
Game script has a significant impact on quarterback prop outcomes. Quarterbacks on trailing teams pass more frequently, which inflates passing yardage and touchdown attempts but also increases interception risk. Quarterbacks on teams with large leads see reduced passing volume in the second half as the offence shifts to running the clock. Using the point spread as a proxy for expected game flow improves passing yardage projections by accounting for the likely pace and passing rate in the second half.
Prepared by the nfl Betting Ofds editorial staff.