NFL Betting Advanced Metrics: EPA, DVOA and ATS Data
 Available in US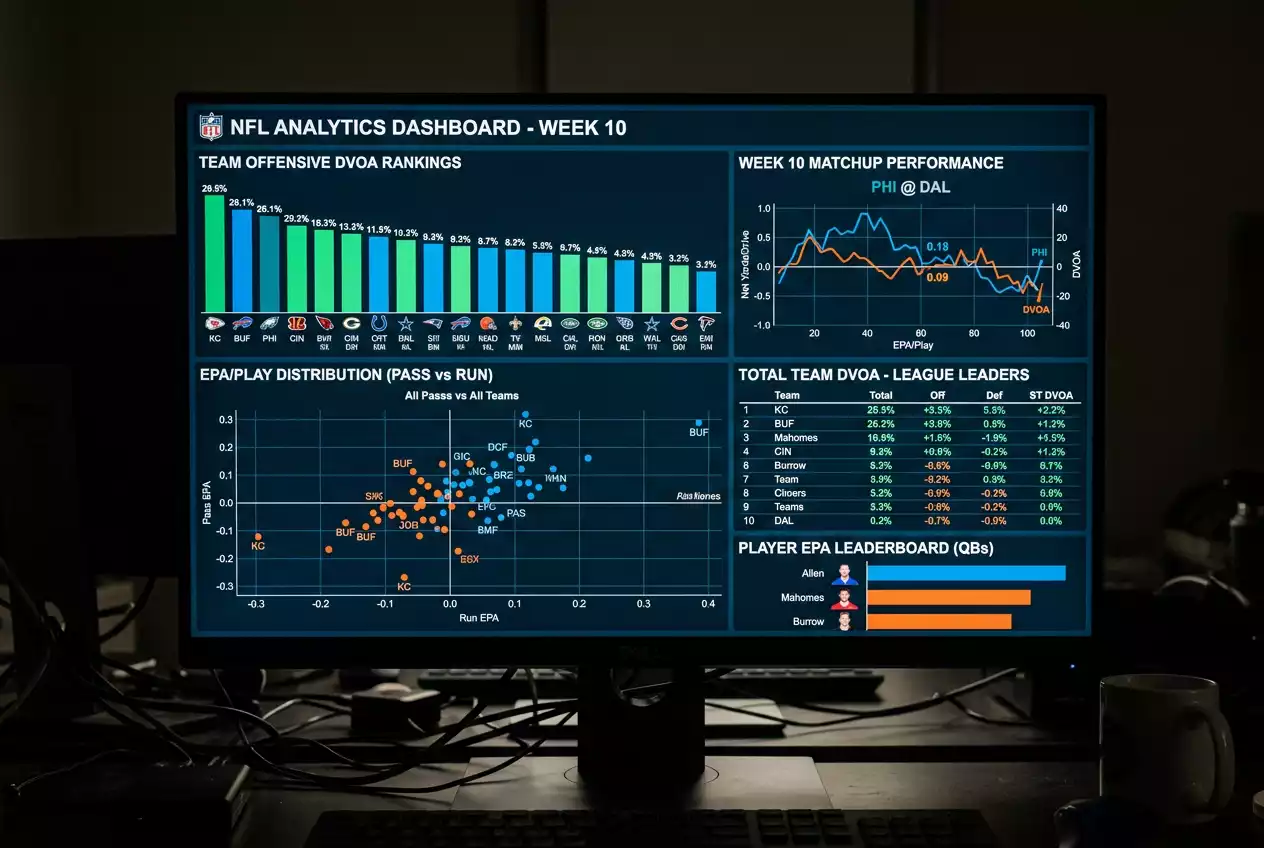
I spent my first three seasons betting NFL games using yards, points, and gut feelings. It worked about as well as you would expect – which is to say, it did not. The shift happened when I started treating football like a data problem instead of a spectacle. Advanced metrics did not make me infallible, but they gave me a framework for asking better questions about every line I considered.
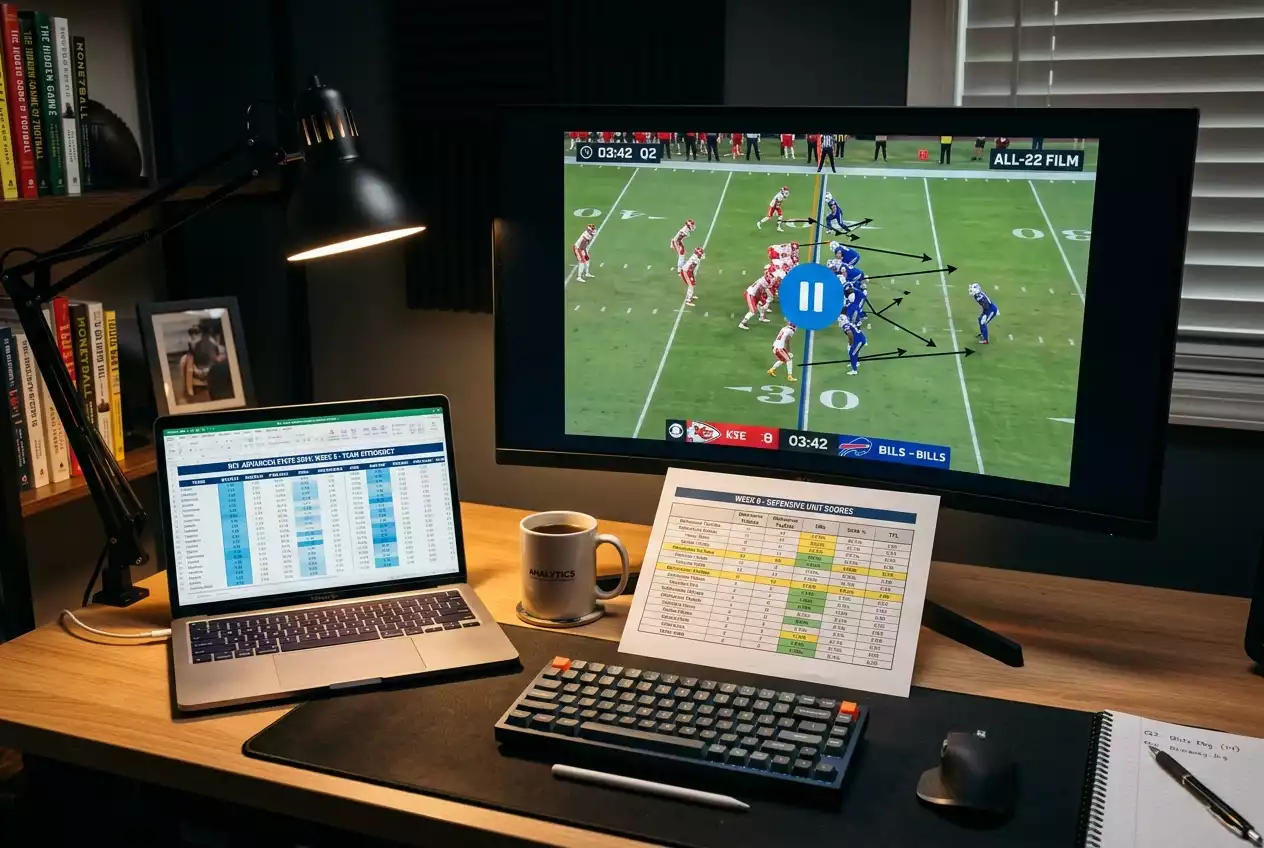
If you have heard terms like EPA, DVOA, or ATS thrown around on betting podcasts and wondered whether they are genuinely useful or just analyst jargon, this is the breakdown. Each metric captures something that traditional statistics miss, and together they form a more complete picture of how a team actually performs – not just how it looks on the scoreboard.
Expected Points Added (EPA) in NFL Betting Markets
A five-yard run on third-and-four is a first down. A five-yard run on third-and-eight is a failure. Traditional yardage stats treat both as identical. Expected Points Added does not.
EPA assigns a point value to every play based on the change in expected scoring from the start of the play to the end. The model uses historical data to determine how many points a team is expected to score from any given down, distance, and field position. If a play advances the offence into a higher-value situation, the EPA is positive. If it leaves the team worse off, the EPA is negative.
For betting, EPA per play is the metric I use most. It strips away volume – a team that runs 80 plays per game will accumulate more raw yards and points than a team that runs 55, but EPA per play normalises for pace and isolates efficiency. A team averaging 0.15 EPA per play on offence is genuinely elite. A team at -0.10 is in serious trouble, regardless of what the league-average points column says.
I run EPA splits by game phase – first half, second half, red zone, third down – to identify where a team over-performs or collapses. A team with strong overall EPA but negative red-zone EPA is converting drives into field goals instead of touchdowns, which creates risk in totals markets. Conversely, a team with modest overall EPA but explosive red-zone EPA may outscore its expected output when it reaches scoring territory.
The NFL generates a higher wagering handle than any other league at operators like DraftKings, despite fewer games than the NBA or MLB – a dynamic that makes per-play efficiency metrics especially relevant for bettors, because the limited sample of sixteen to eighteen games per season magnifies the importance of precision over volume.
DVOA: Adjusting for Opponents and Situations
Two seasons ago, a team finished the regular season ranked sixth in total defence by yardage. They were also twenty-second in DVOA. The discrepancy was simple: they had played one of the easiest offensive schedules in the league. Strip away the weak opponents, adjust for game situations, and the defence was below average. I bet against them in the playoffs. They were eliminated in the wild card round.
Defence-adjusted Value Over Average – DVOA – was developed by Football Outsiders and measures a team’s efficiency on every play compared to a league-average baseline, adjusted for opponent strength, game situation, and field position. A team with a DVOA of 20% is performing 20% better than average across all its plays. A team at -15% is performing 15% worse.
The opponent adjustment is what makes DVOA valuable for betting. Raw statistics are polluted by schedule strength. A team that plays three consecutive games against bottom-five defences will look like an offensive juggernaut in the box score but may regress sharply when it faces a league-average opponent. DVOA accounts for this by weighting each play according to the quality of the opposing unit.
I use DVOA primarily for spread analysis. When two teams meet and the spread feels generous, I check the DVOA gap between them. A ten-point DVOA difference correlates roughly with a half-touchdown advantage on a neutral field. If the spread is three points but the DVOA gap suggests five to six points, the favourite may be underpriced. If the spread is seven but the DVOA gap is only four, the underdog has value.
ATS Trends and What They Reveal About Market Efficiency
Against-the-spread records are the most accessible advanced metric for bettors – and the most dangerous to misuse. US sports betting revenue grew 22.8% to 16.96 billion dollars in 2025, per AGA data, and a significant share of that volume flowed through NFL spread markets. The ATS record tells you how a team has performed relative to the line, but it does not tell you why.
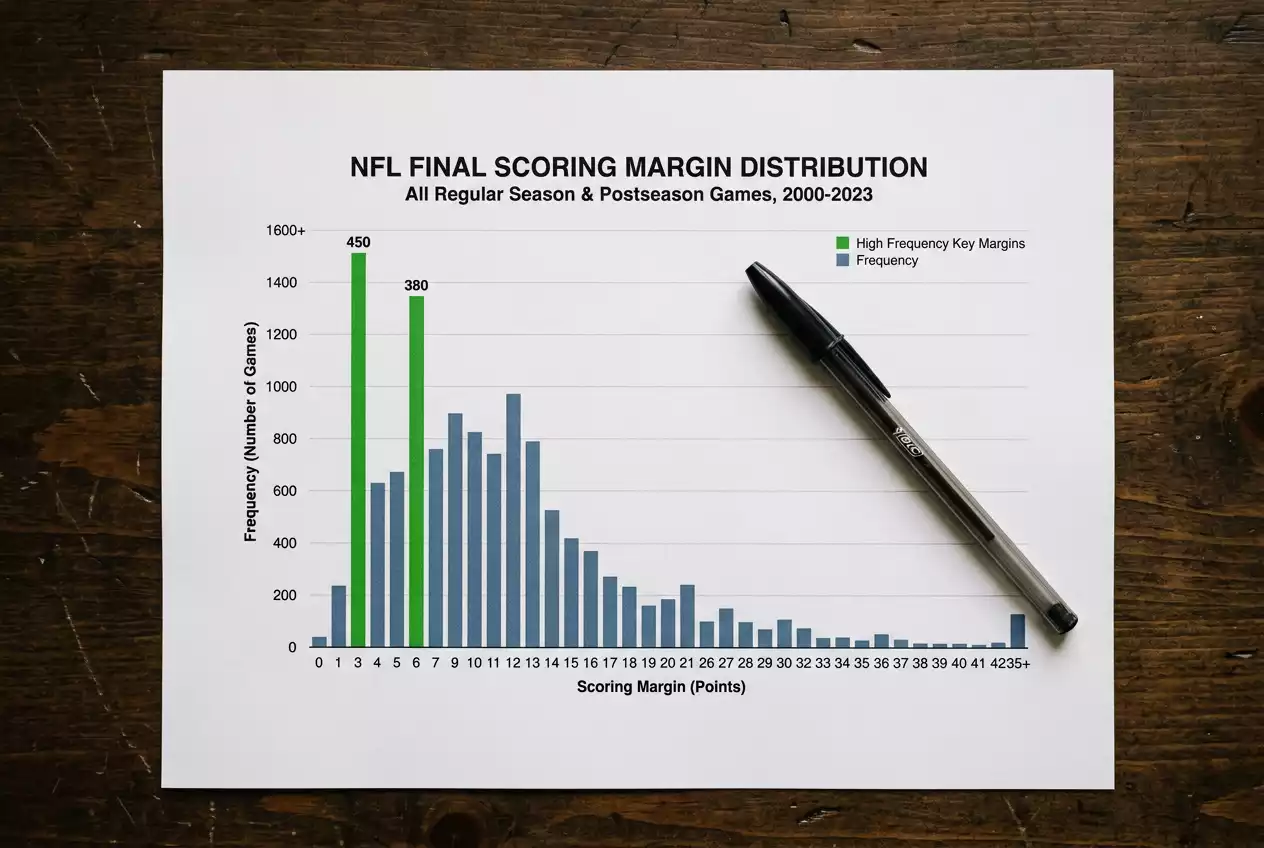
A team that is 8-2 ATS through ten weeks might be legitimately underpriced by the market – or it might have been lucky. Margins in the NFL are razor-thin. A fumble recovery here, a missed field goal there, and a team’s ATS record swings by two or three games. Small-sample randomness dominates early-season ATS records, and treating a 5-1 ATS start as predictive is the kind of pattern-matching that costs money.
Where ATS trends become useful is in larger samples and specific contexts. Teams coming off bye weeks have a historically positive ATS record that holds across decades of data. Road underdogs of three to seven points cover at a slightly higher rate than the overall average. Divisional games tend to be tighter than non-divisional games, which means favourites cover less often. These patterns are well-documented and statistically robust enough to trust – but none of them alone is a betting system. They are inputs, not answers.
I track ATS records as a supporting data point alongside EPA and DVOA, not as a standalone signal. If a team is 7-3 ATS, leads the league in offensive EPA per play, and ranks in the top five in DVOA, the convergence of evidence gives me confidence. If the ATS record is strong but the underlying metrics are mediocre, I treat the record with suspicion and look for regression.
Advanced metrics do not guarantee profits. They guarantee better questions. Instead of asking “Will the Chiefs win?” I ask “Is the Chiefs’ offensive EPA per play sustainable against a defence ranked in the top ten by DVOA?” Instead of following a team’s ATS streak, I ask whether the streak is driven by genuine efficiency or by close calls going the right way. For a deeper look at how these metrics feed into practical wagering decisions, the guide on NFL value betting strategy connects the analytical framework to the bet slip.
What is EPA and how does it apply to NFL betting?
EPA stands for Expected Points Added. It measures the value of each play by calculating the change in expected scoring based on down, distance, and field position. For betting, EPA per play is the most useful form because it normalises for pace and isolates true offensive or defensive efficiency. A team with a high EPA per play is generating scoring opportunities at an above-average rate, which is a stronger predictor of future performance than raw yardage or points.
Are ATS records a reliable predictor of future NFL results?
ATS records are useful as supporting context but unreliable as a standalone predictor, especially in small samples. Early-season records are heavily influenced by randomness – a team at 5-1 ATS after six weeks may simply have been on the right side of close finishes. Larger samples and specific situational trends, such as post-bye performance or road underdog cover rates, are more robust. The strongest approach combines ATS trends with efficiency metrics like EPA and DVOA to identify convergent signals.
Prepared by the nfl Betting Ofds editorial staff.